hdWGCNA Analysis
Preface
IMPORTANT
hdWGCNA (hierarchical dictionary Weighted Gene Co-expression Network Analysis) is an important tool in single-cell transcriptomics for constructing gene co-expression networks and identifying functional modules. By integrating cell type-specific gene expression patterns, it helps researchers understand the gene regulatory mechanisms underlying cell heterogeneity and identify functional gene modules specific to cell types or states.
In single-cell research, we not only focus on expression differences of individual genes but also want to understand the coordinated regulatory relationships between genes. By constructing gene co-expression networks and identifying functionally related gene modules, hdWGCNA provides important clues for analyzing cell functions and development.
Core Functions of hdWGCNA
- Gene Co-expression Network Construction: Construct cell type-specific gene co-expression networks based on gene expression correlations
- Functional Module Identification: Identify gene modules that are co-expressed in specific cell types
- Module Characteristic Analysis: Calculate Module Eigengenes and evaluate their biological significance
- Module Specificity Analysis: Identify gene modules that are specifically expressed in certain cell types
This document aims to provide a detailed technical guide to hdWGCNA for single-cell researchers, covering its basic principles, operation methods on the SeekSoul™ Online platform, result interpretation, practical cases, and common questions, helping you quickly master and apply this tool.
Theoretical Basis of hdWGCNA
Core Principles
The core idea of hdWGCNA is: By identifying co-expression patterns between genes, construct cell type-specific gene co-expression networks, and identify functionally related gene modules. This process can be summarized into the following main steps:
- Gene Selection: Select gene sets suitable for co-expression analysis based on gene expression characteristics
- Network Construction: Construct weighted gene co-expression networks based on gene expression correlations
- Module Identification: Identify gene modules in the network through hierarchical clustering and other methods
- Module Characteristic Analysis: Calculate Module Eigengenes for each module
- Biological Significance Evaluation: Evaluate the biological functions of modules through enrichment analysis and other methods
Key Algorithm Details
Weighted Gene Co-expression Network Construction
- Principle: Calculate the connection strength between genes based on gene expression correlations to construct a weighted undirected graph
- Method: Use the soft threshold method to convert gene expression correlations into connection strengths, with the formula
- Advantage: Compared to unweighted networks, weighted networks better preserve information about correlations between genes
Module Identification
- Principle: Identify gene modules through dynamic tree cutting algorithm
- Method:
- Calculate the module adjacency matrix
- Perform hierarchical clustering
- Use dynamic tree cutting algorithm to identify clustering branches
- Assign color identifiers to each module
Module Eigengenes
- Definition: The first principal component of all gene expressions in a module
- Significance: Represents the expression characteristics of the entire module
- Application: Used for correlation analysis between modules and downstream biological analysis
Evaluation of Biological Significance of Modules
Functional Enrichment Analysis
- Method: Perform GO/KEGG and other functional enrichment analyses on genes in each module
- Application: Inferred potential biological functions of modules
Module and Cell Type Association Analysis
- Method: Calculate the overlap between module characteristic genes and cell type marker genes
- Application: Identify functional modules specific to cell types
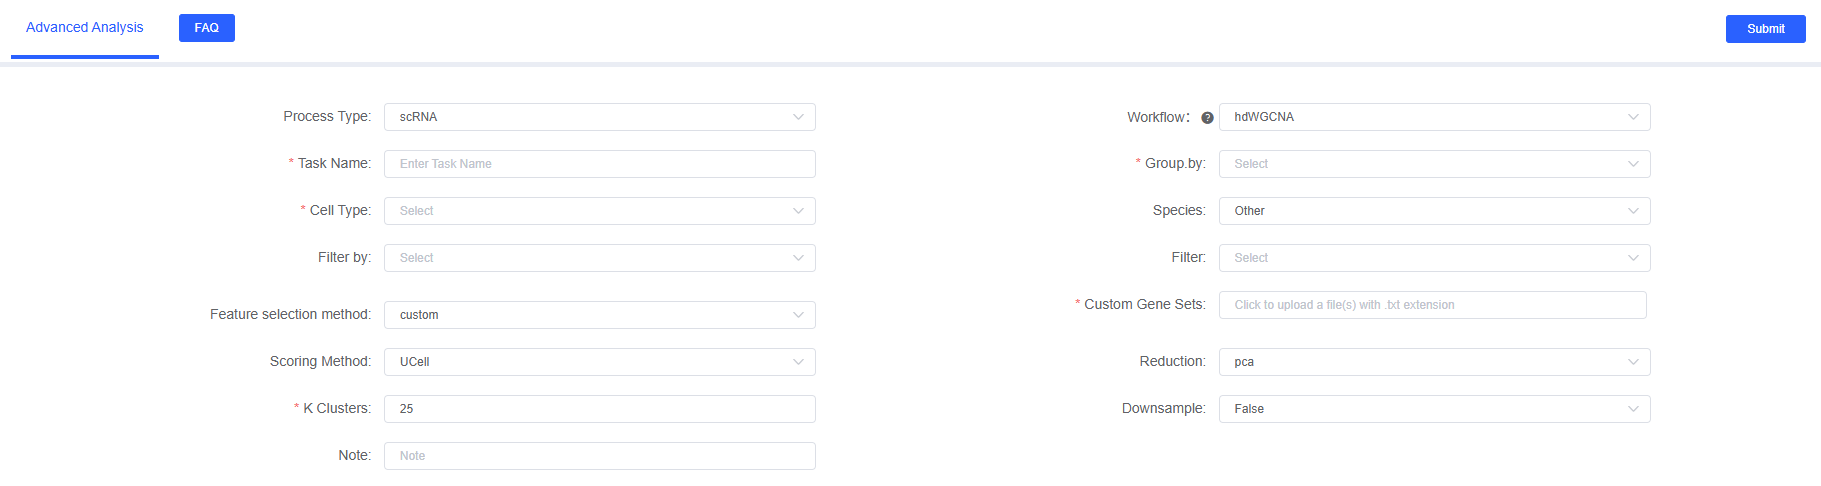
SeekSoul™ Online Operation Guide
On SeekSoul™ Online, the hdWGCNA analysis process is designed to be intuitive and easy to use. You don't need to write code; you can complete the analysis through the parameter configuration interface.
Preparation Before Analysis
IMPORTANT
The success of hdWGCNA analysis largely depends on the quality of input data and the rationality of biological questions. Before starting the analysis, please make sure:
- Data has been preprocessed: Your single-cell data has undergone standard quality control, dimensionality reduction, clustering, and cell type annotation.
- Appropriate cell subpopulations have been selected: hdWGCNA analysis should be performed in biologically meaningful cell subpopulations, such as annotated cell types or functionally related cell clusters.
- Data scale is moderate: For datasets with more than tens of thousands of cells, it is recommended to enable Downsample to avoid memory不足.
Parameter Details
The following table details the main parameters and their descriptions of the hdWGCNA analysis module on SeekSoul™ Online.
| Interface Parameter | Description |
|---|---|
| Task Name | The name of this analysis task, must start with an English letter, can contain English letters, numbers, underscores, and Chinese characters. |
| Group.by | The column name in meta, consistent with grouping factors in other processes, e.g., Cellannotation, required. |
| Cell Type | The objects corresponding to the meta column based on the grouping factor, e.g., T, B..., required. |
| Species | human|other. |
| Filter by | The column name in meta, consistent with grouping factors in other processes, not required, mutually exclusive with Group.by. |
| Filter | Objects corresponding to the meta column based on the filter factor, multiple selection allowed, not required. |
| Feature selection method | Methods for selecting genes for co-expression network analysis: variable|fraction|custom - variable: Use highly variable genes stored in Seurat objects - fraction: Use genes expressed in a certain proportion of cells in a group - custom: Custom gene set, gene_list must be specified after selection |
| Percentage of Genes | Displayed when gene selection method is fraction, input box, number 0-1 (two decimal places), default filled 0.2. |
| Custom Gene Sets | Displayed when gene selection method is custom. |
| Scoring Method | Seurat|UCell. Default filled UCell. |
| Reduction | pca|harmony, drop-down box single selection, default pca. |
| K Clusters | Input box, integer from 25-75, default filled 25. |
| Downsample | Default filled False, drop-down box single selection True or False. |
| Downsample_num | Default filled 1000, number, manually edited and filled (displayed when True). |
| Note | Custom remark information. |
Important Notes
CAUTION
- Big Dataset Processing: When the total number of cells exceeds tens of thousands, if the
Downsampleparameter is set toFalse, the analysis may fail due to insufficient memory. It is strongly recommended to enableDownsamplefor analysis. - Metadata Specification: Please ensure that the metadata column names and content in the RDS file do not contain Chinese characters or special characters (such as
&), otherwise it may cause process errors. - Species Matching: Ensure the selected species matches the actual data, otherwise it will affect the accuracy of the enrichment analysis database.
Operation Process
- Enter Analysis Module: Navigate to the "Advanced Analysis" module on SeekSoul™ Online and select "hdWGCNA".
- Create New Task: Name your analysis task and select the sample or project to be analyzed.
- Configure Parameters: Select the cell type, grouping information, etc. according to the above guidelines.
- Submit Task: After confirming the parameters are correct, click the "Submit" button and wait for the analysis to complete.
- Download and View: After the analysis is completed, download and view the generated analysis report and result files in the task list.
Result Interpretation
The hdWGCNA analysis report contains rich charts and data files. The following is a detailed interpretation of the core results.
Result File List
| File Name | Content Description |
|---|---|
*_KME_modules.csv | KME (Module Membership) values of genes in the module, reflecting the correlation between genes and the module. |
*_cluster_allDMEs.csv | Differential analysis results of module characteristic genes between different cell types. |
*_cluster_findallmarkers.csv | Cell type marker genes identified by FindAllMarkers. |
*_hdWGCNA_findallmarkers_overlap_result.csv | Overlap results between hdWGCNA module genes and FindAllMarkers marker genes. |
*_modules_GOenrich_result.txt | GO functional enrichment analysis results of genes in each module. |
modules_count.txt | Number of identified modules. |
Module Identification and Characteristic Analysis
Soft Threshold Selection Plot
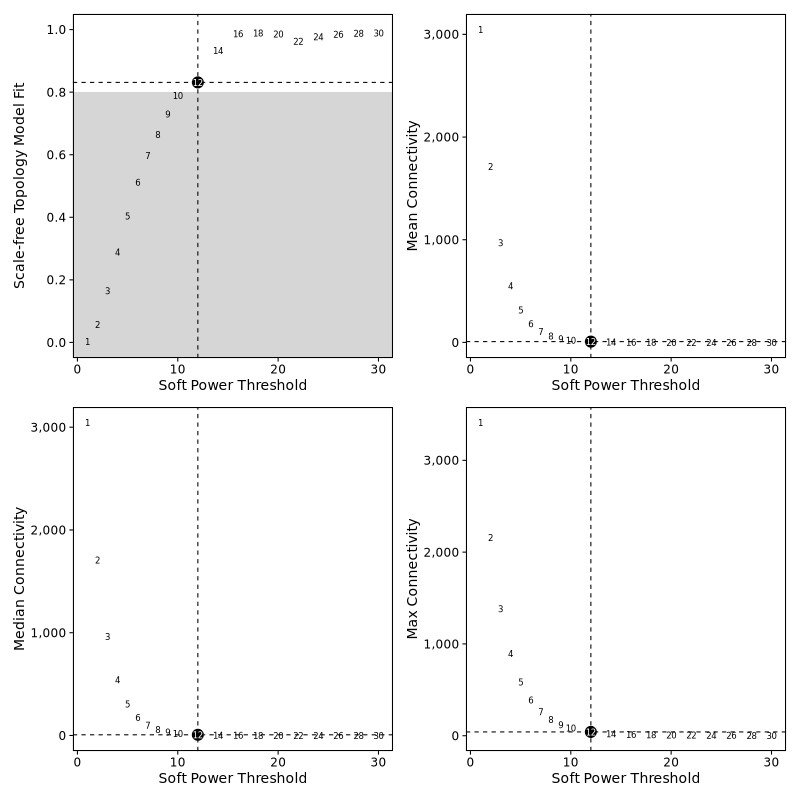
- Chart Interpretation: Shows network connectivity, average connectivity, and fitting index under different soft thresholds.
- Selection Principle: Select a soft threshold with high fitting index and moderate average connectivity.
Module Dendrogram
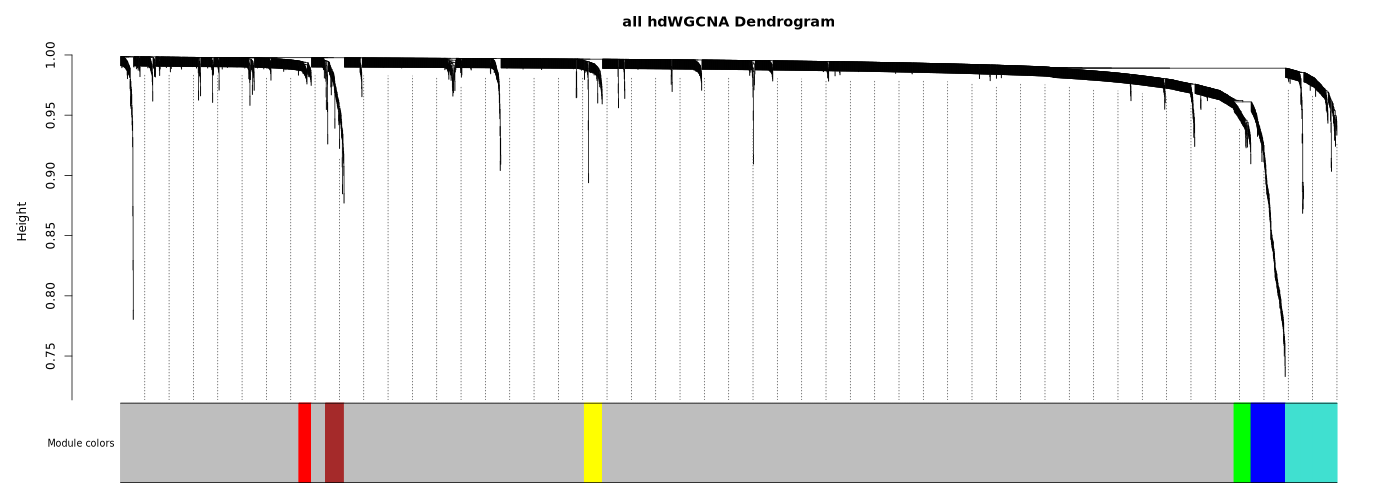
- Chart Interpretation: Shows gene hierarchical clustering results, with different colors representing different modules.
- Grey Module: A collection of genes not assigned to any module.
Module Correlation Heatmap
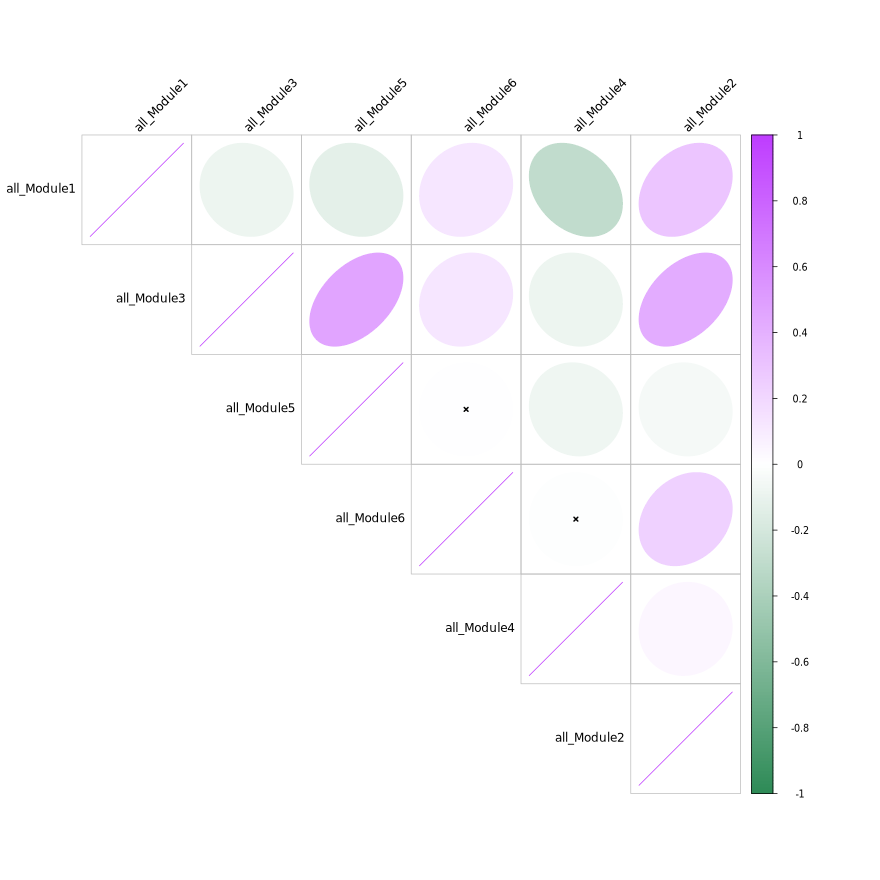
- Chart Interpretation: Shows the correlation between characteristic genes of different modules.
- Color Meaning: Purple indicates positive correlation, green indicates negative correlation.
Module Functional Analysis
Module KME Value Plot
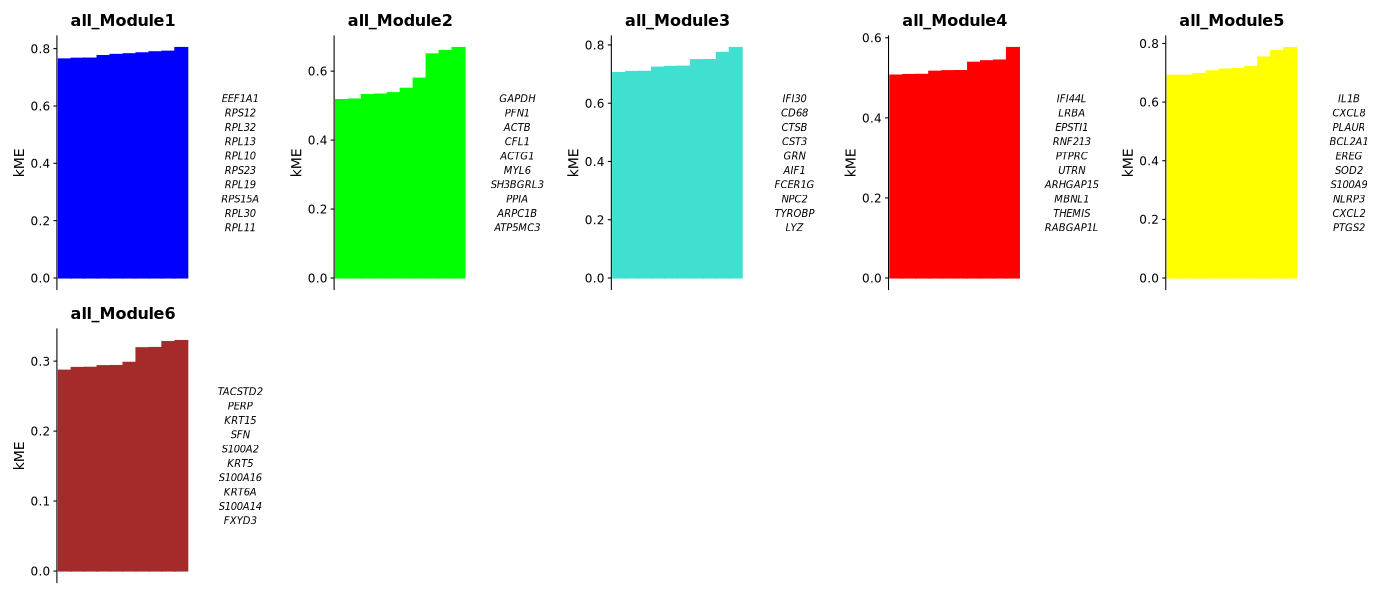
- Chart Interpretation: Shows the top 10 genes with the highest KME values in each module.
- KME Value Meaning: The correlation between a gene and the module's characteristic gene; higher values indicate greater module membership.
Module Network Plot
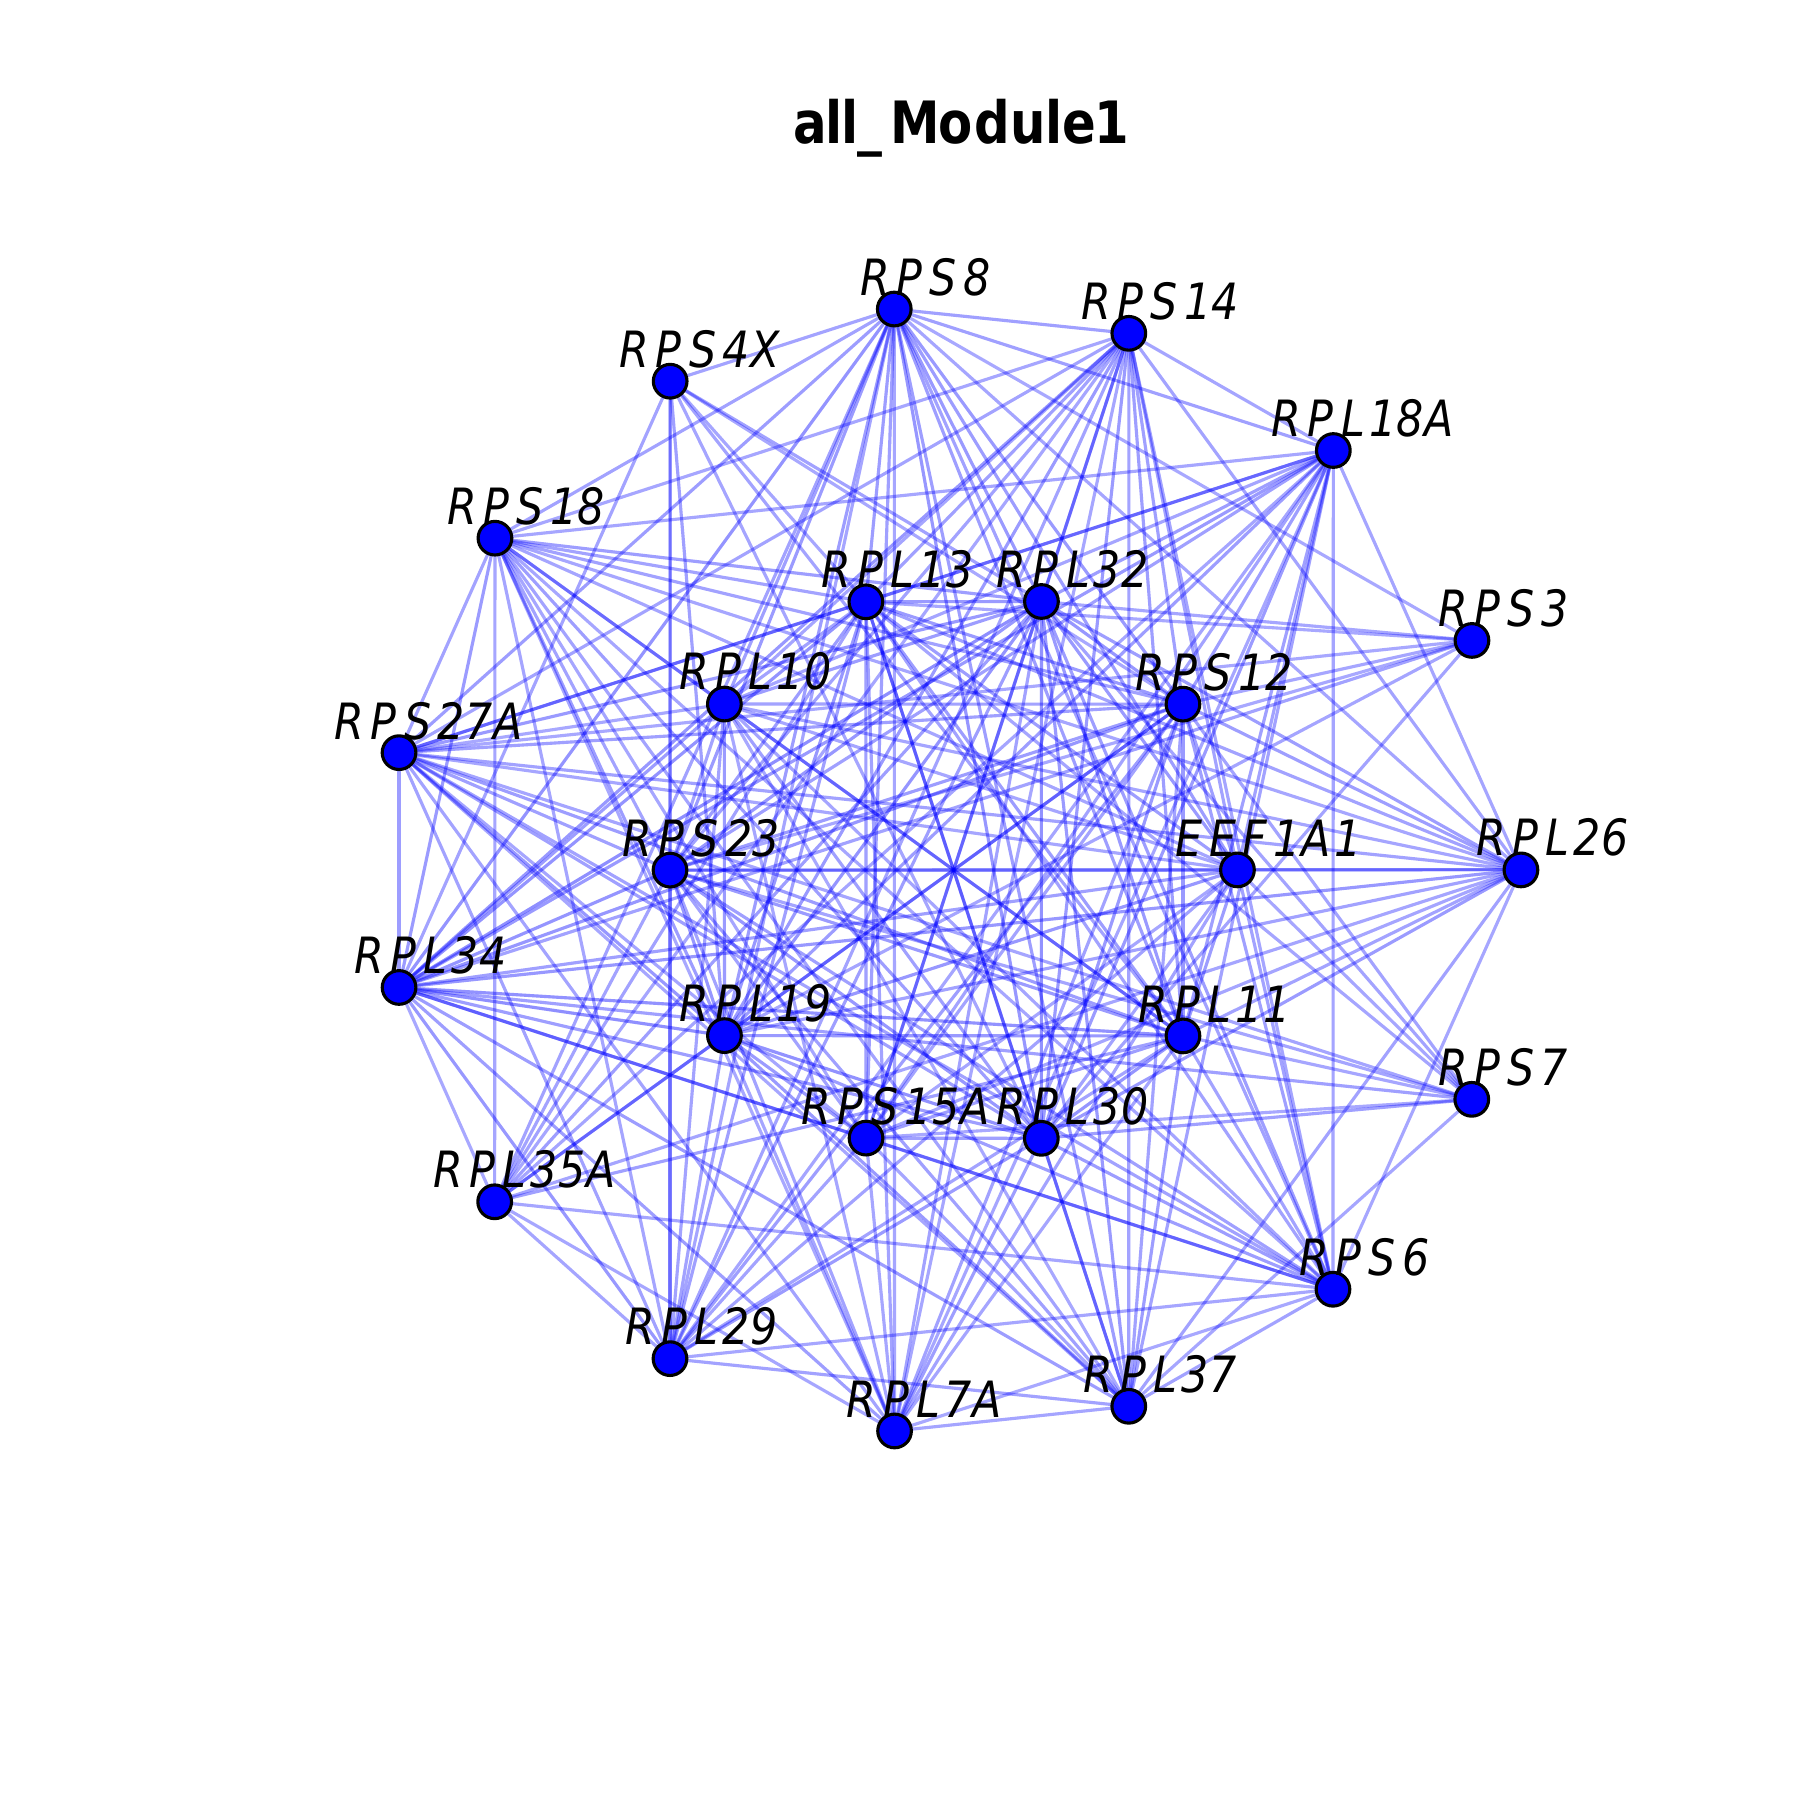
- Chart Interpretation: Shows the co-expression network structure of genes in the module.
- Node Size: Represents the KME value of the gene.
- Edge Thickness: Represents the connection strength between genes.
Module Activity Visualization
UMAP Plot
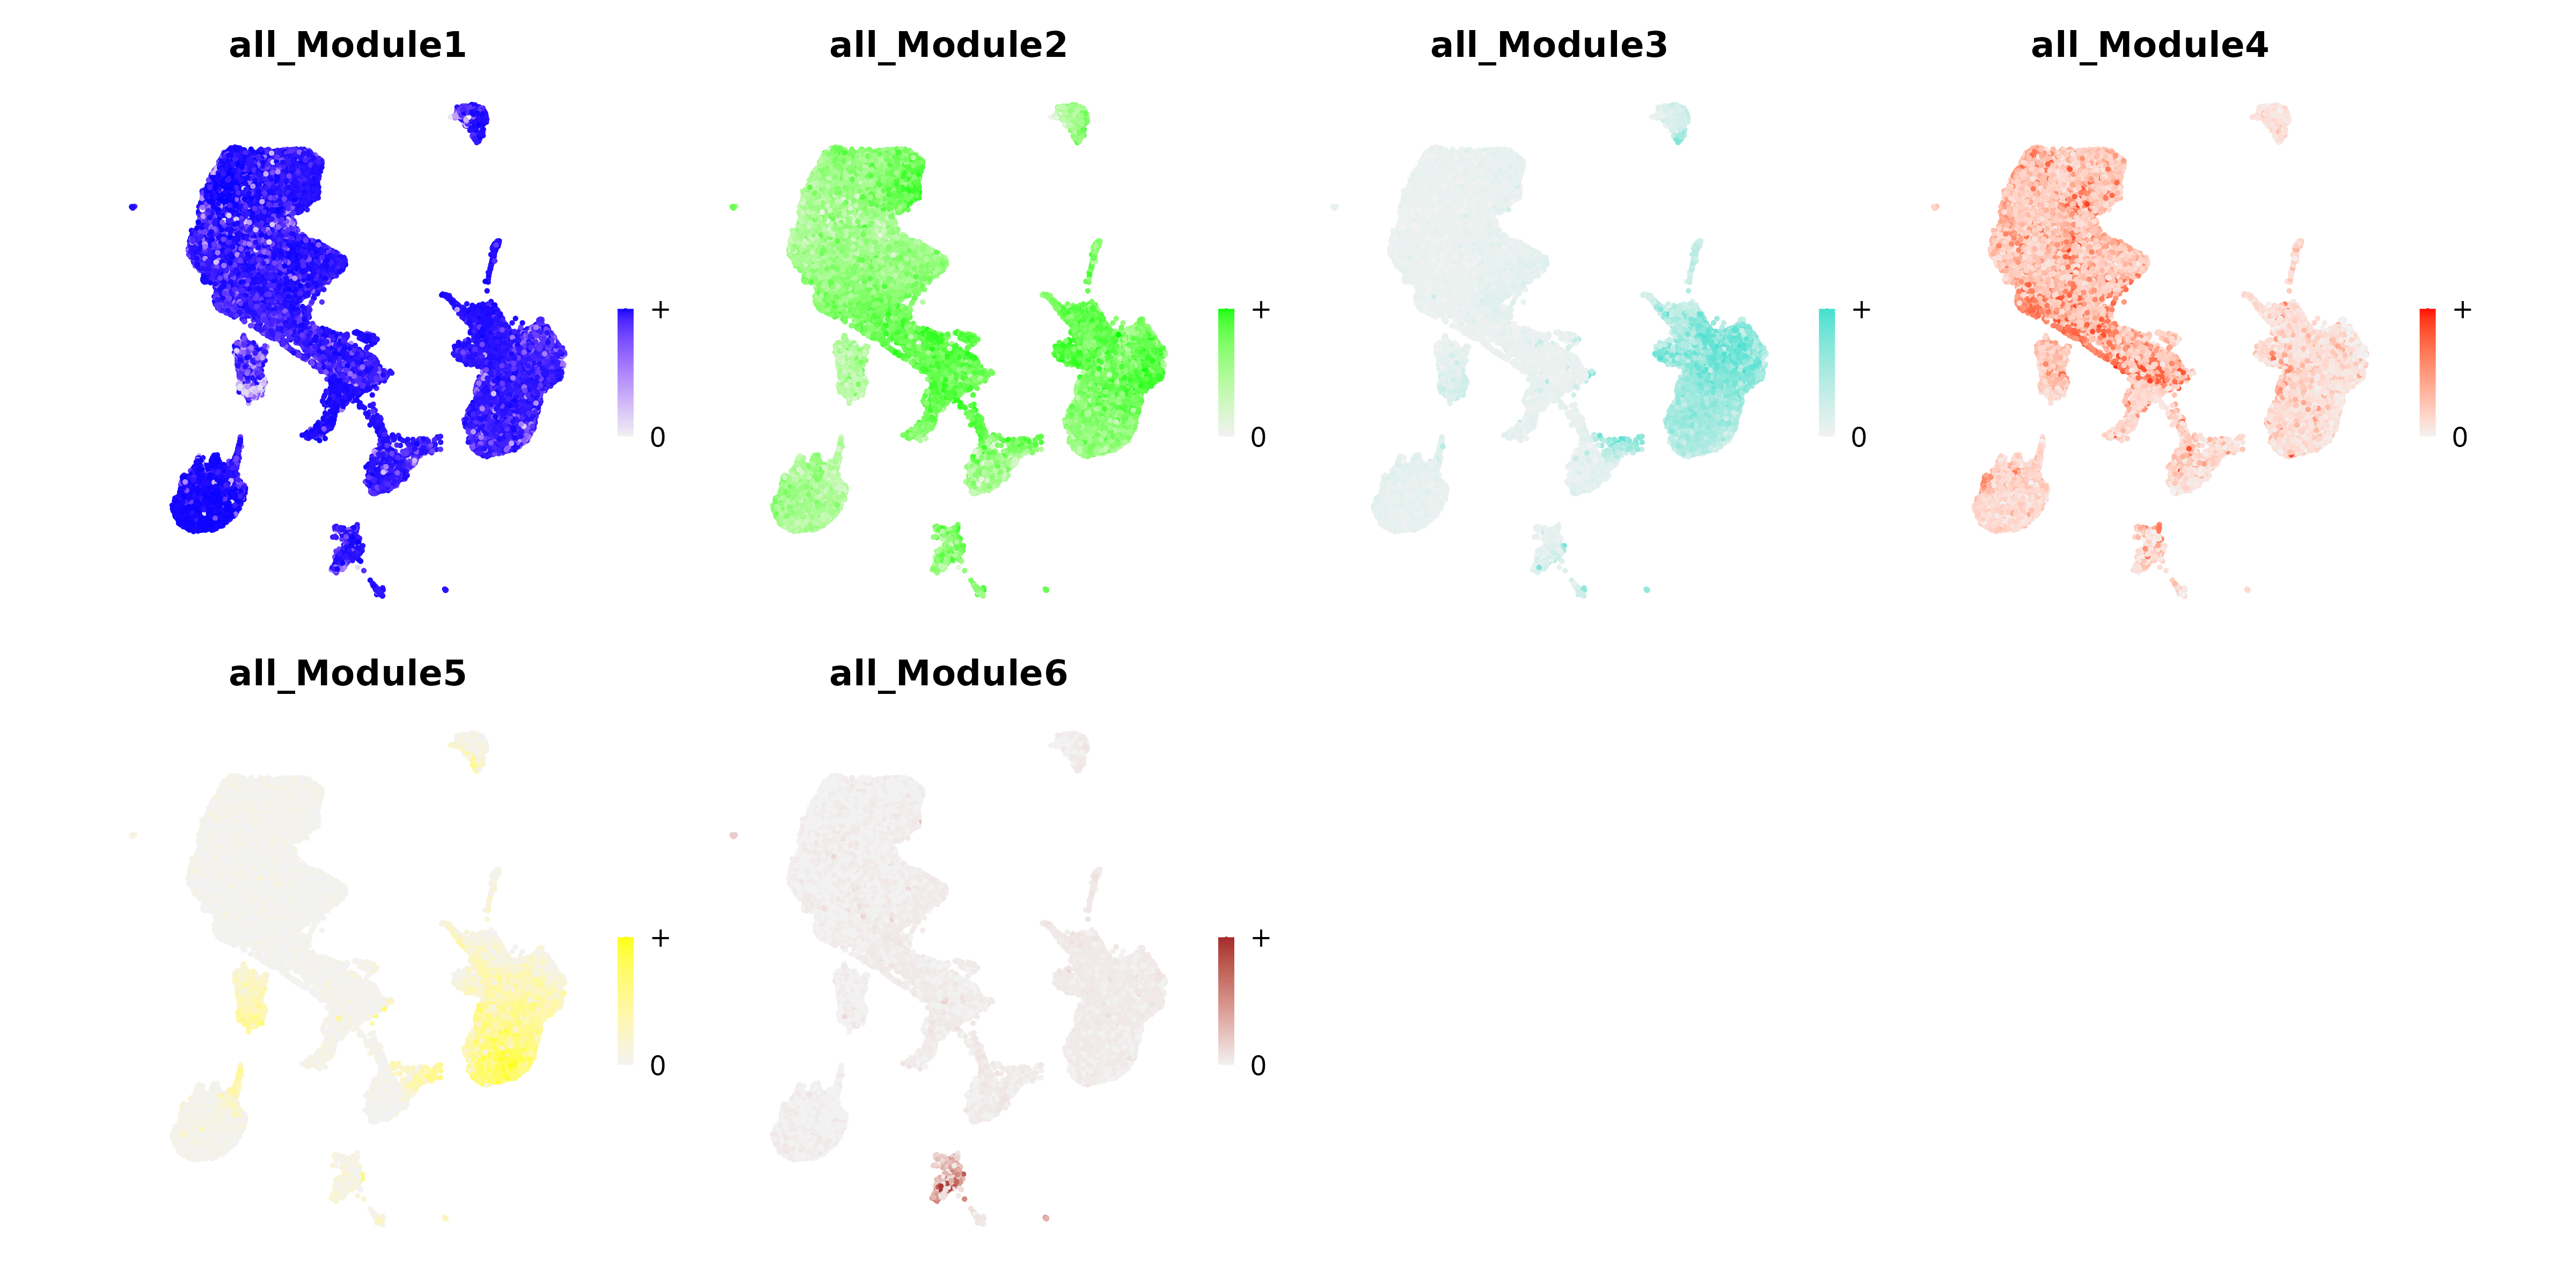
- Chart Interpretation: Shows the spatial distribution of module activity on the UMAP plot.
- Color Meaning: Darker colors indicate higher activity, lighter colors indicate lower activity.
Violin Plot
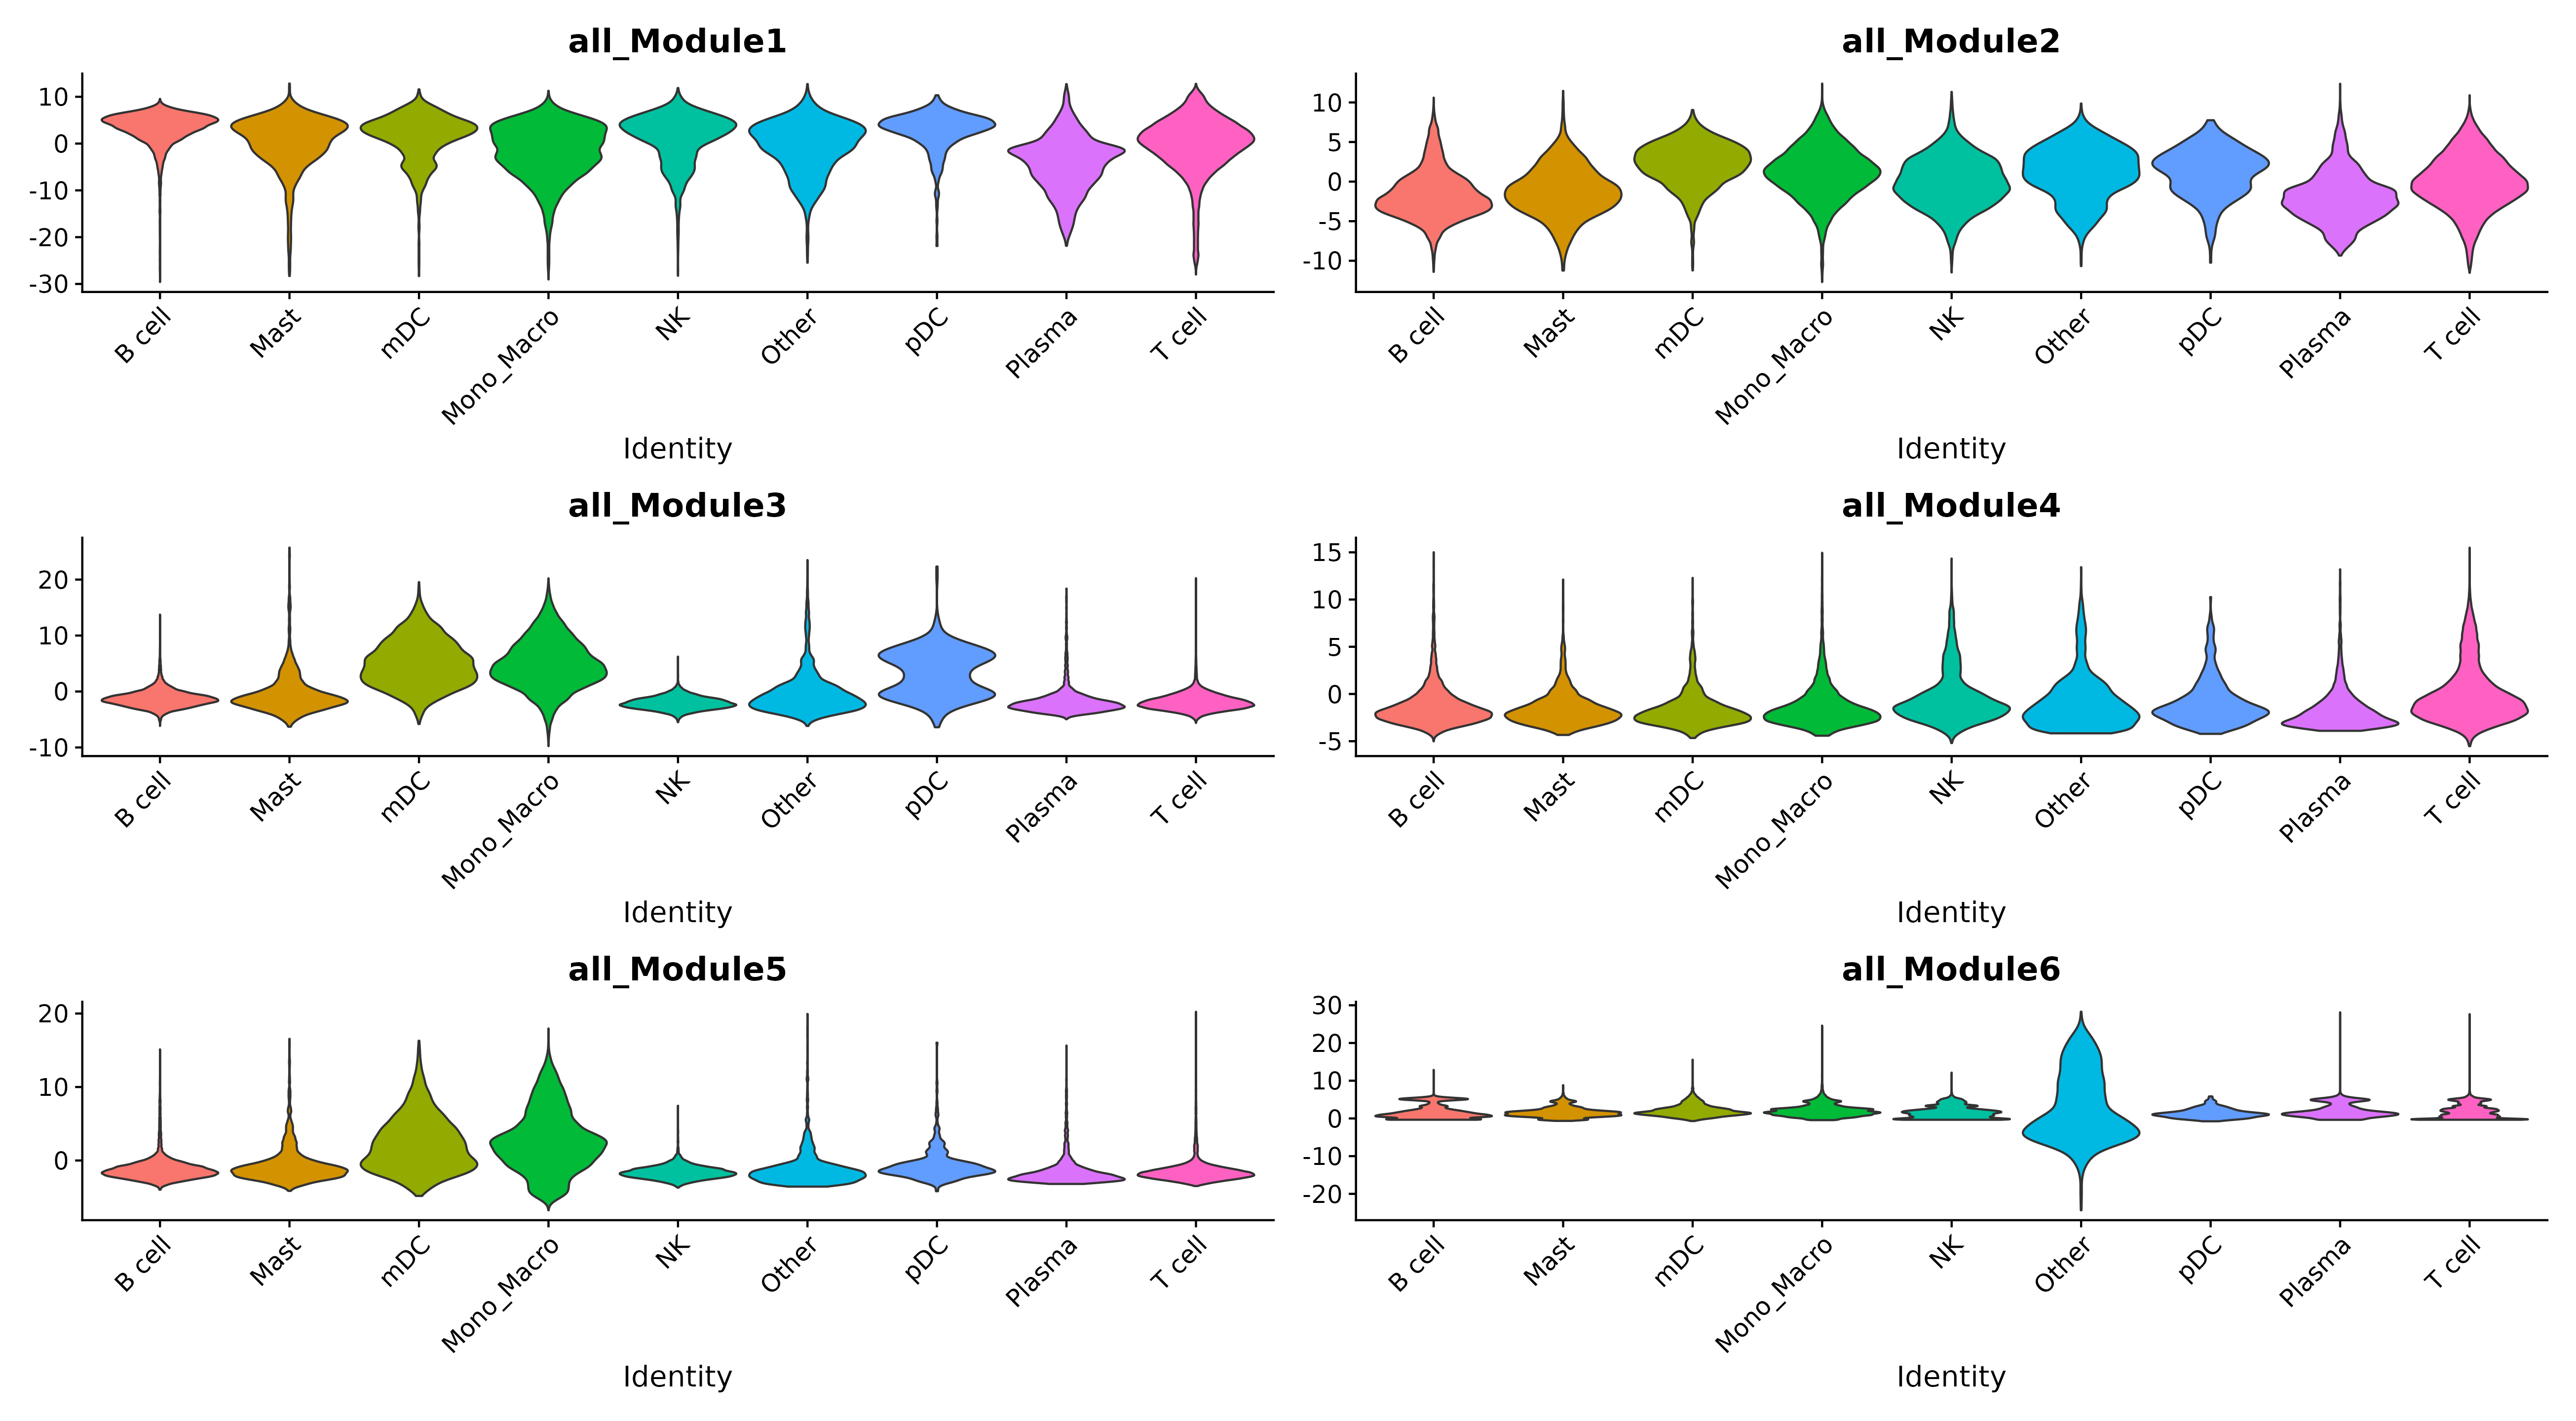
- Chart Interpretation: Shows the distribution of module activity in different cell types.
- Application: Identify functional modules specific to cell types.
Dot Plot
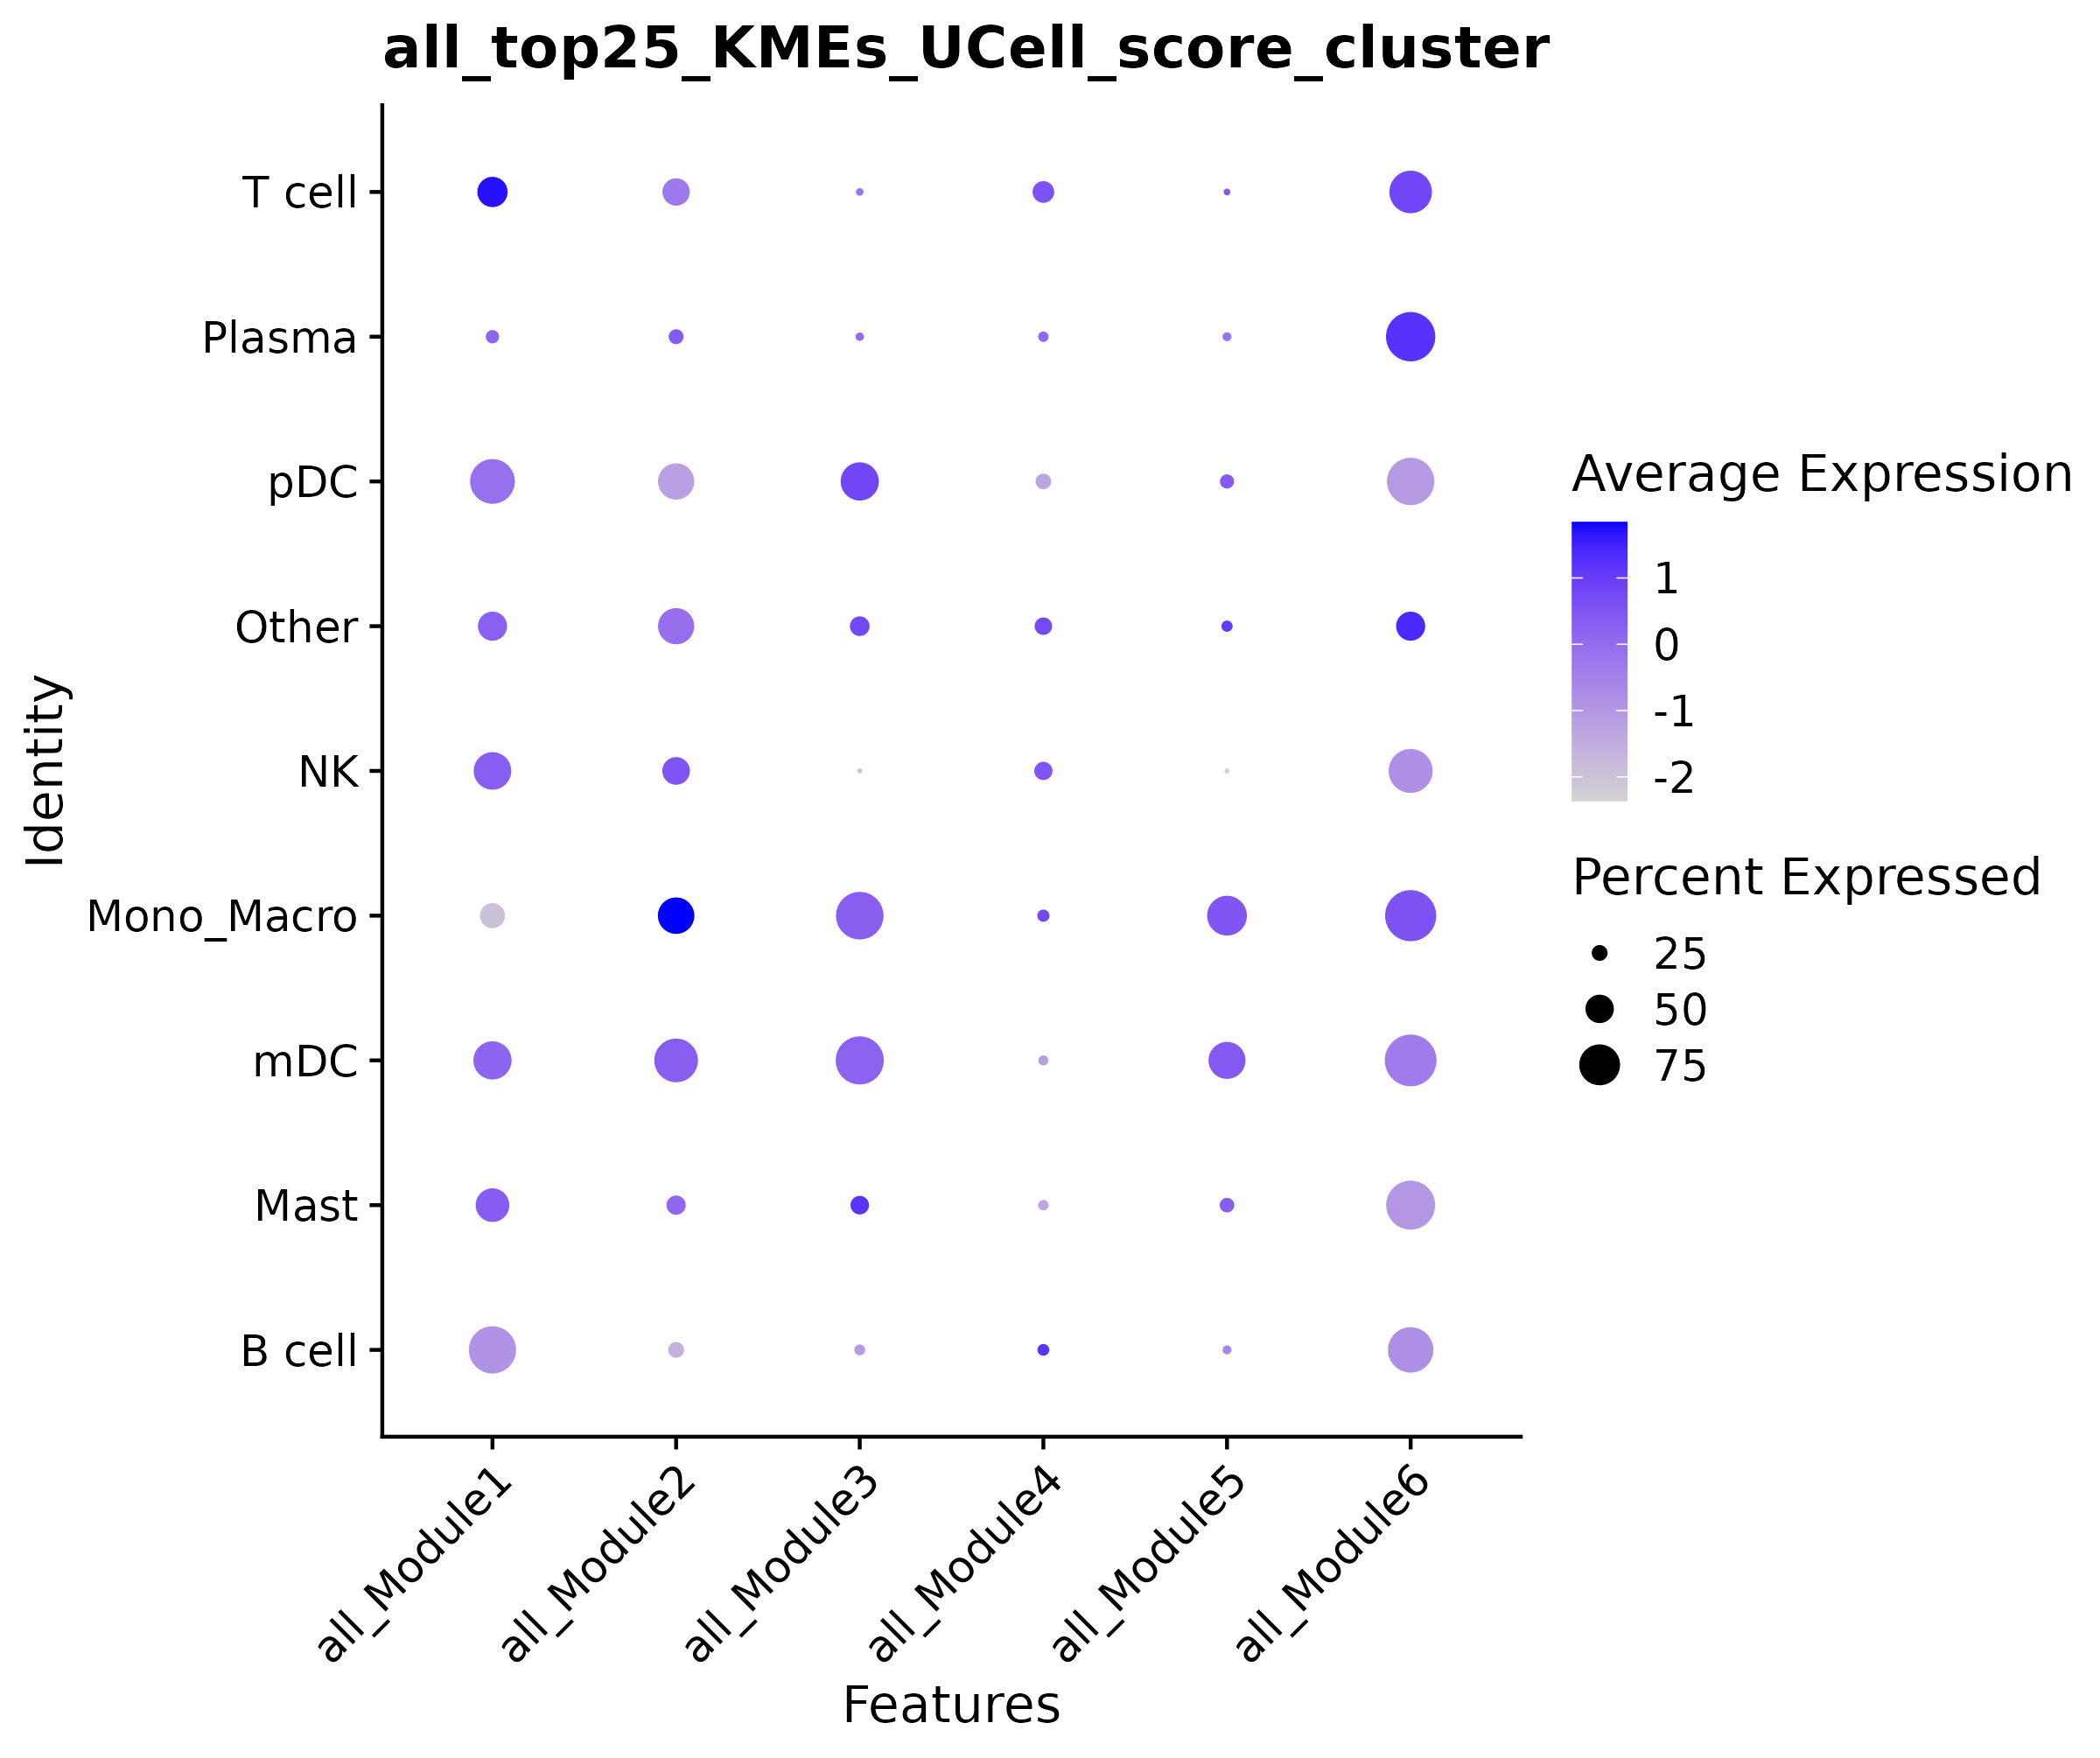
- Chart Interpretation: Shows the average level and expression proportion of module activity in different cell types.
- Color Meaning: Blue indicates high activity, light colors indicate low activity.
- Dot Size: Represents the proportion of cells expressing the gene in the cell type.
Module Differential Analysis
Differential Heatmap
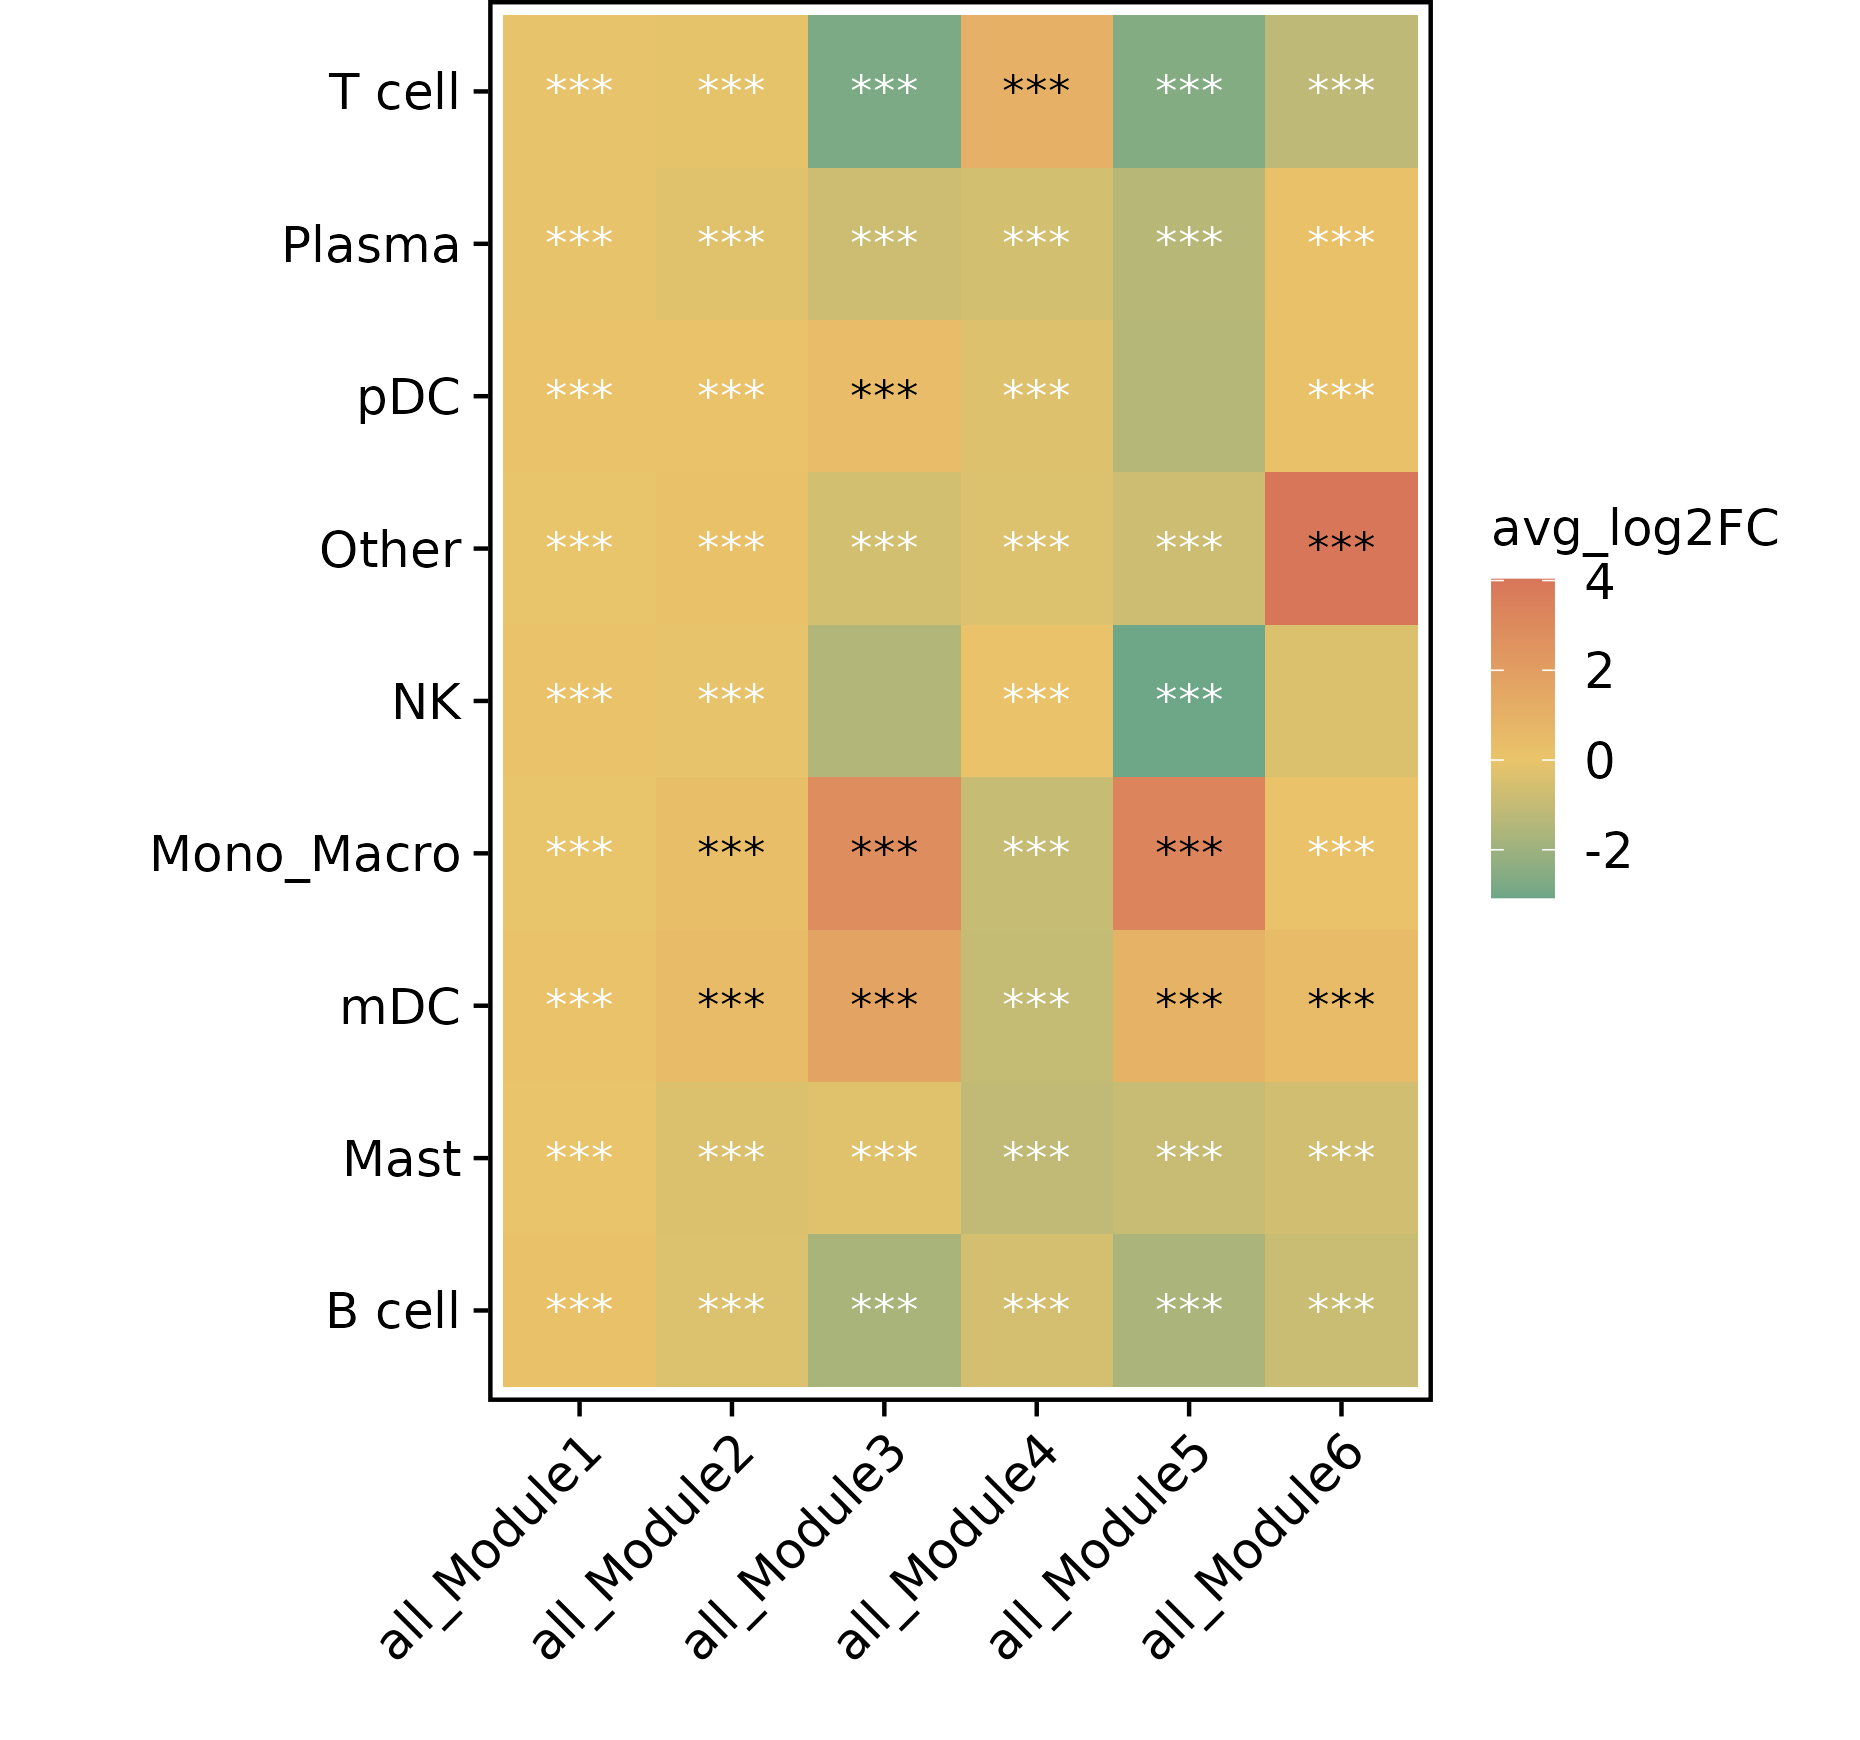
- Chart Interpretation: Shows the differences in module activity between different cell types.
- Color Meaning: Red indicates upregulation, green indicates downregulation.
- Asterisk Annotation: Indicates the level of significance.
Volcano Plot
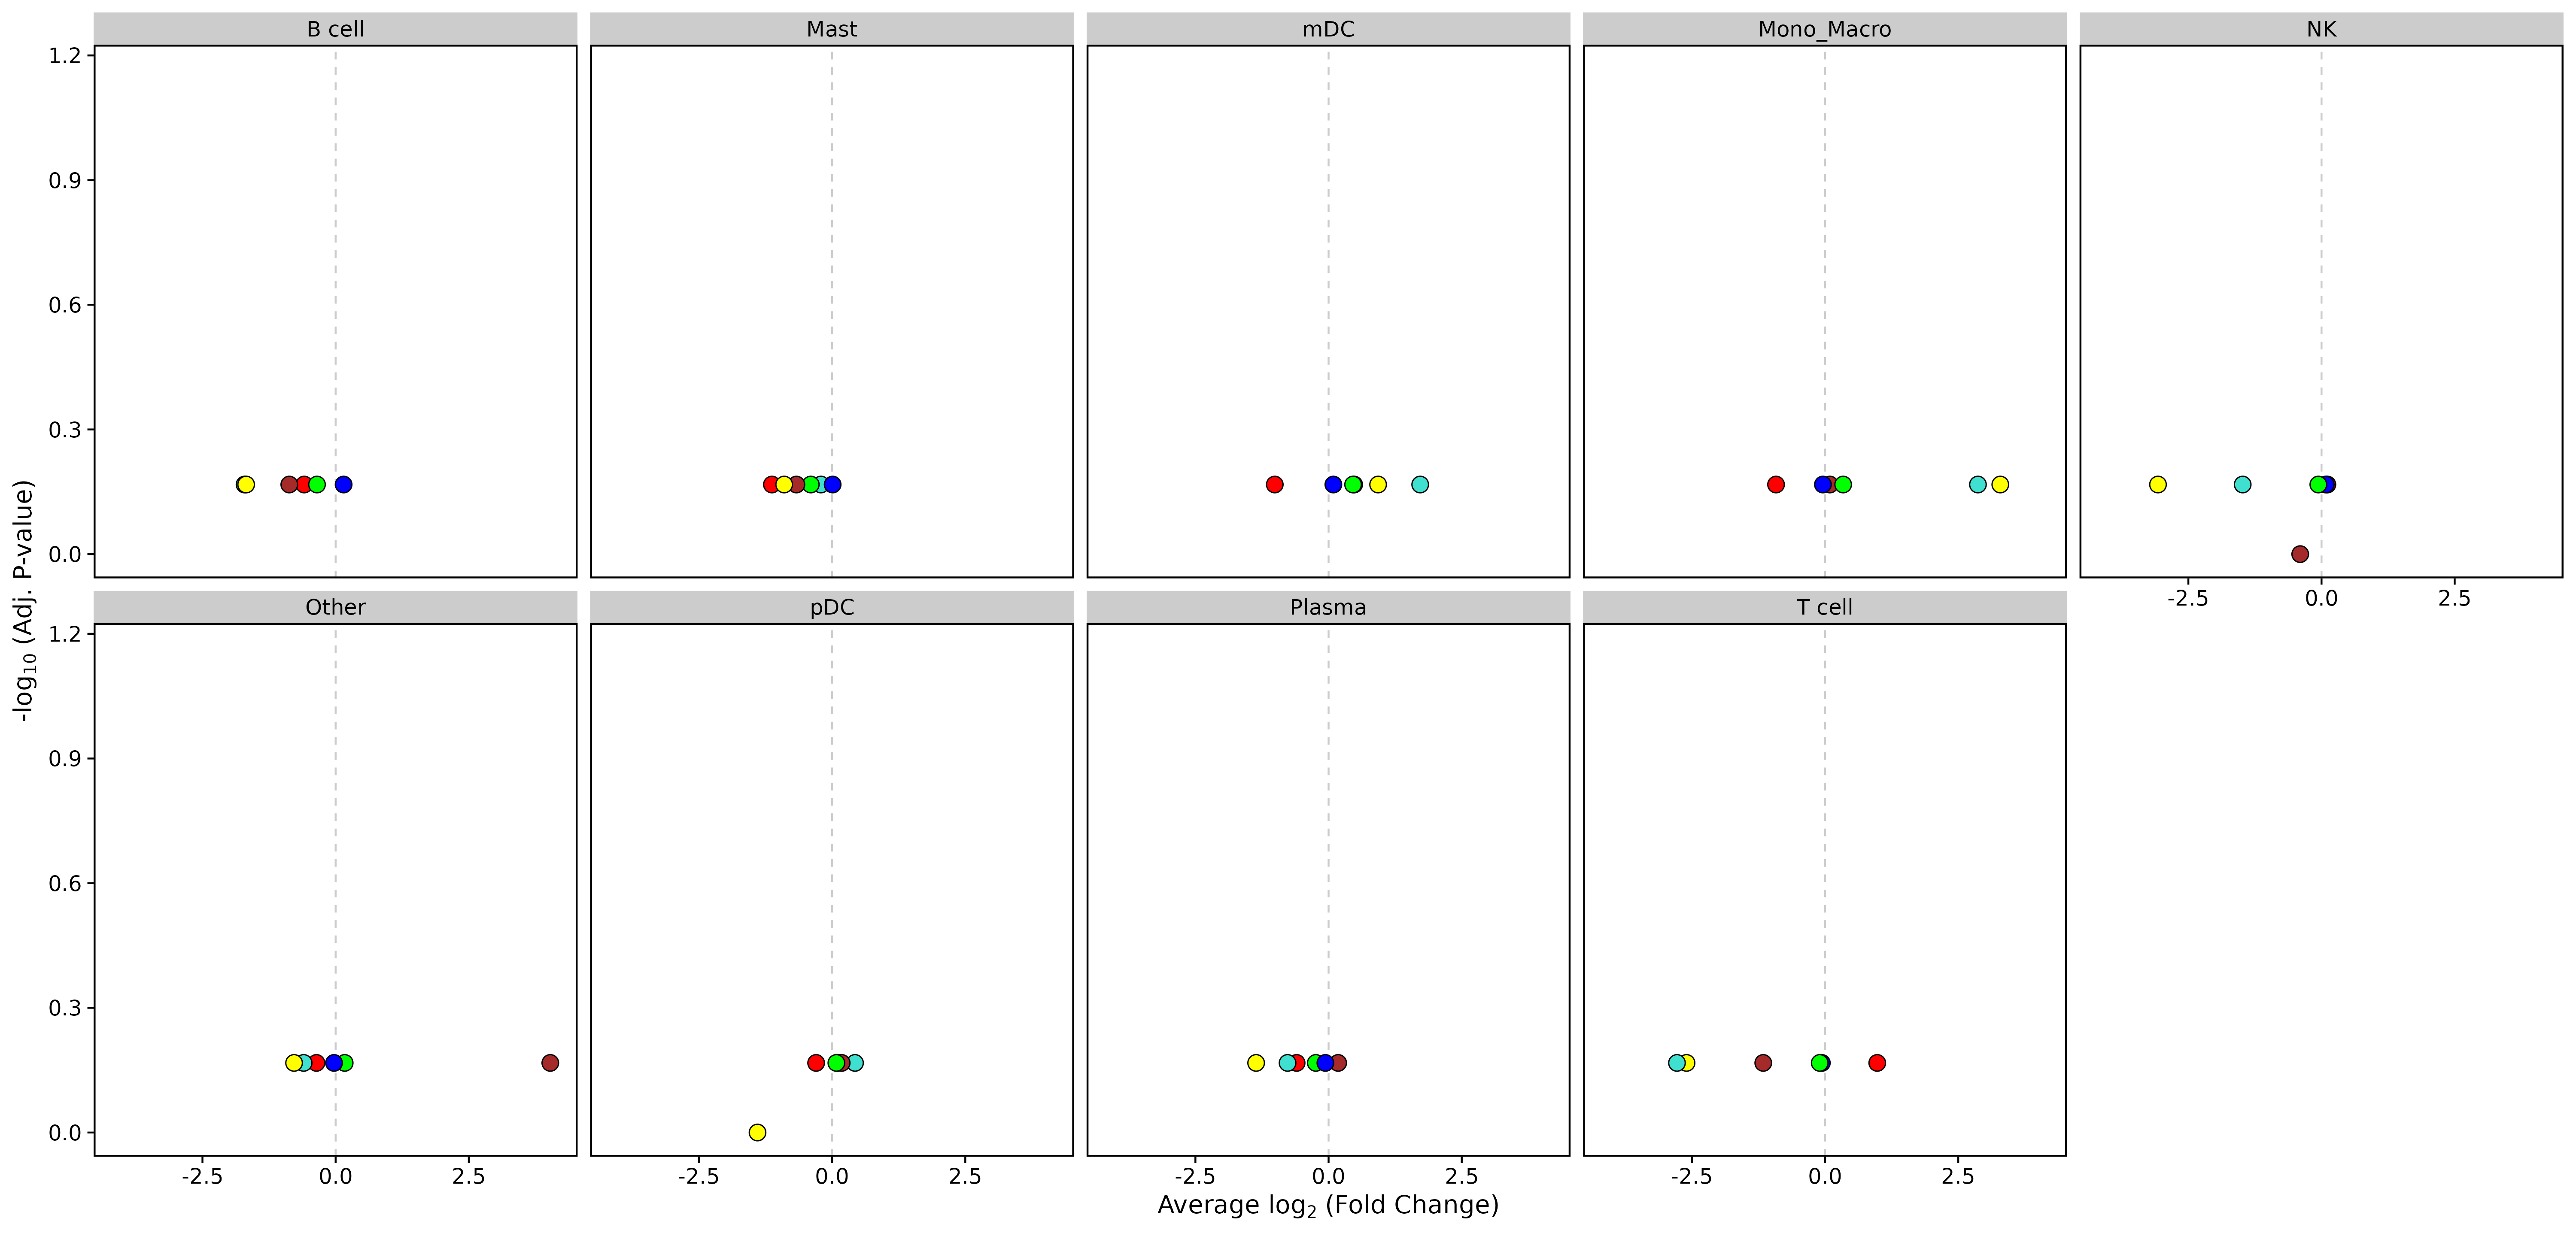
- Chart Interpretation: Shows the results of differential analysis of module activity in different cell types.
- X-axis: log2 fold change
- Y-axis: -log10(adjusted p-value)
Functional Enrichment Analysis
GO Enrichment Dot Plot
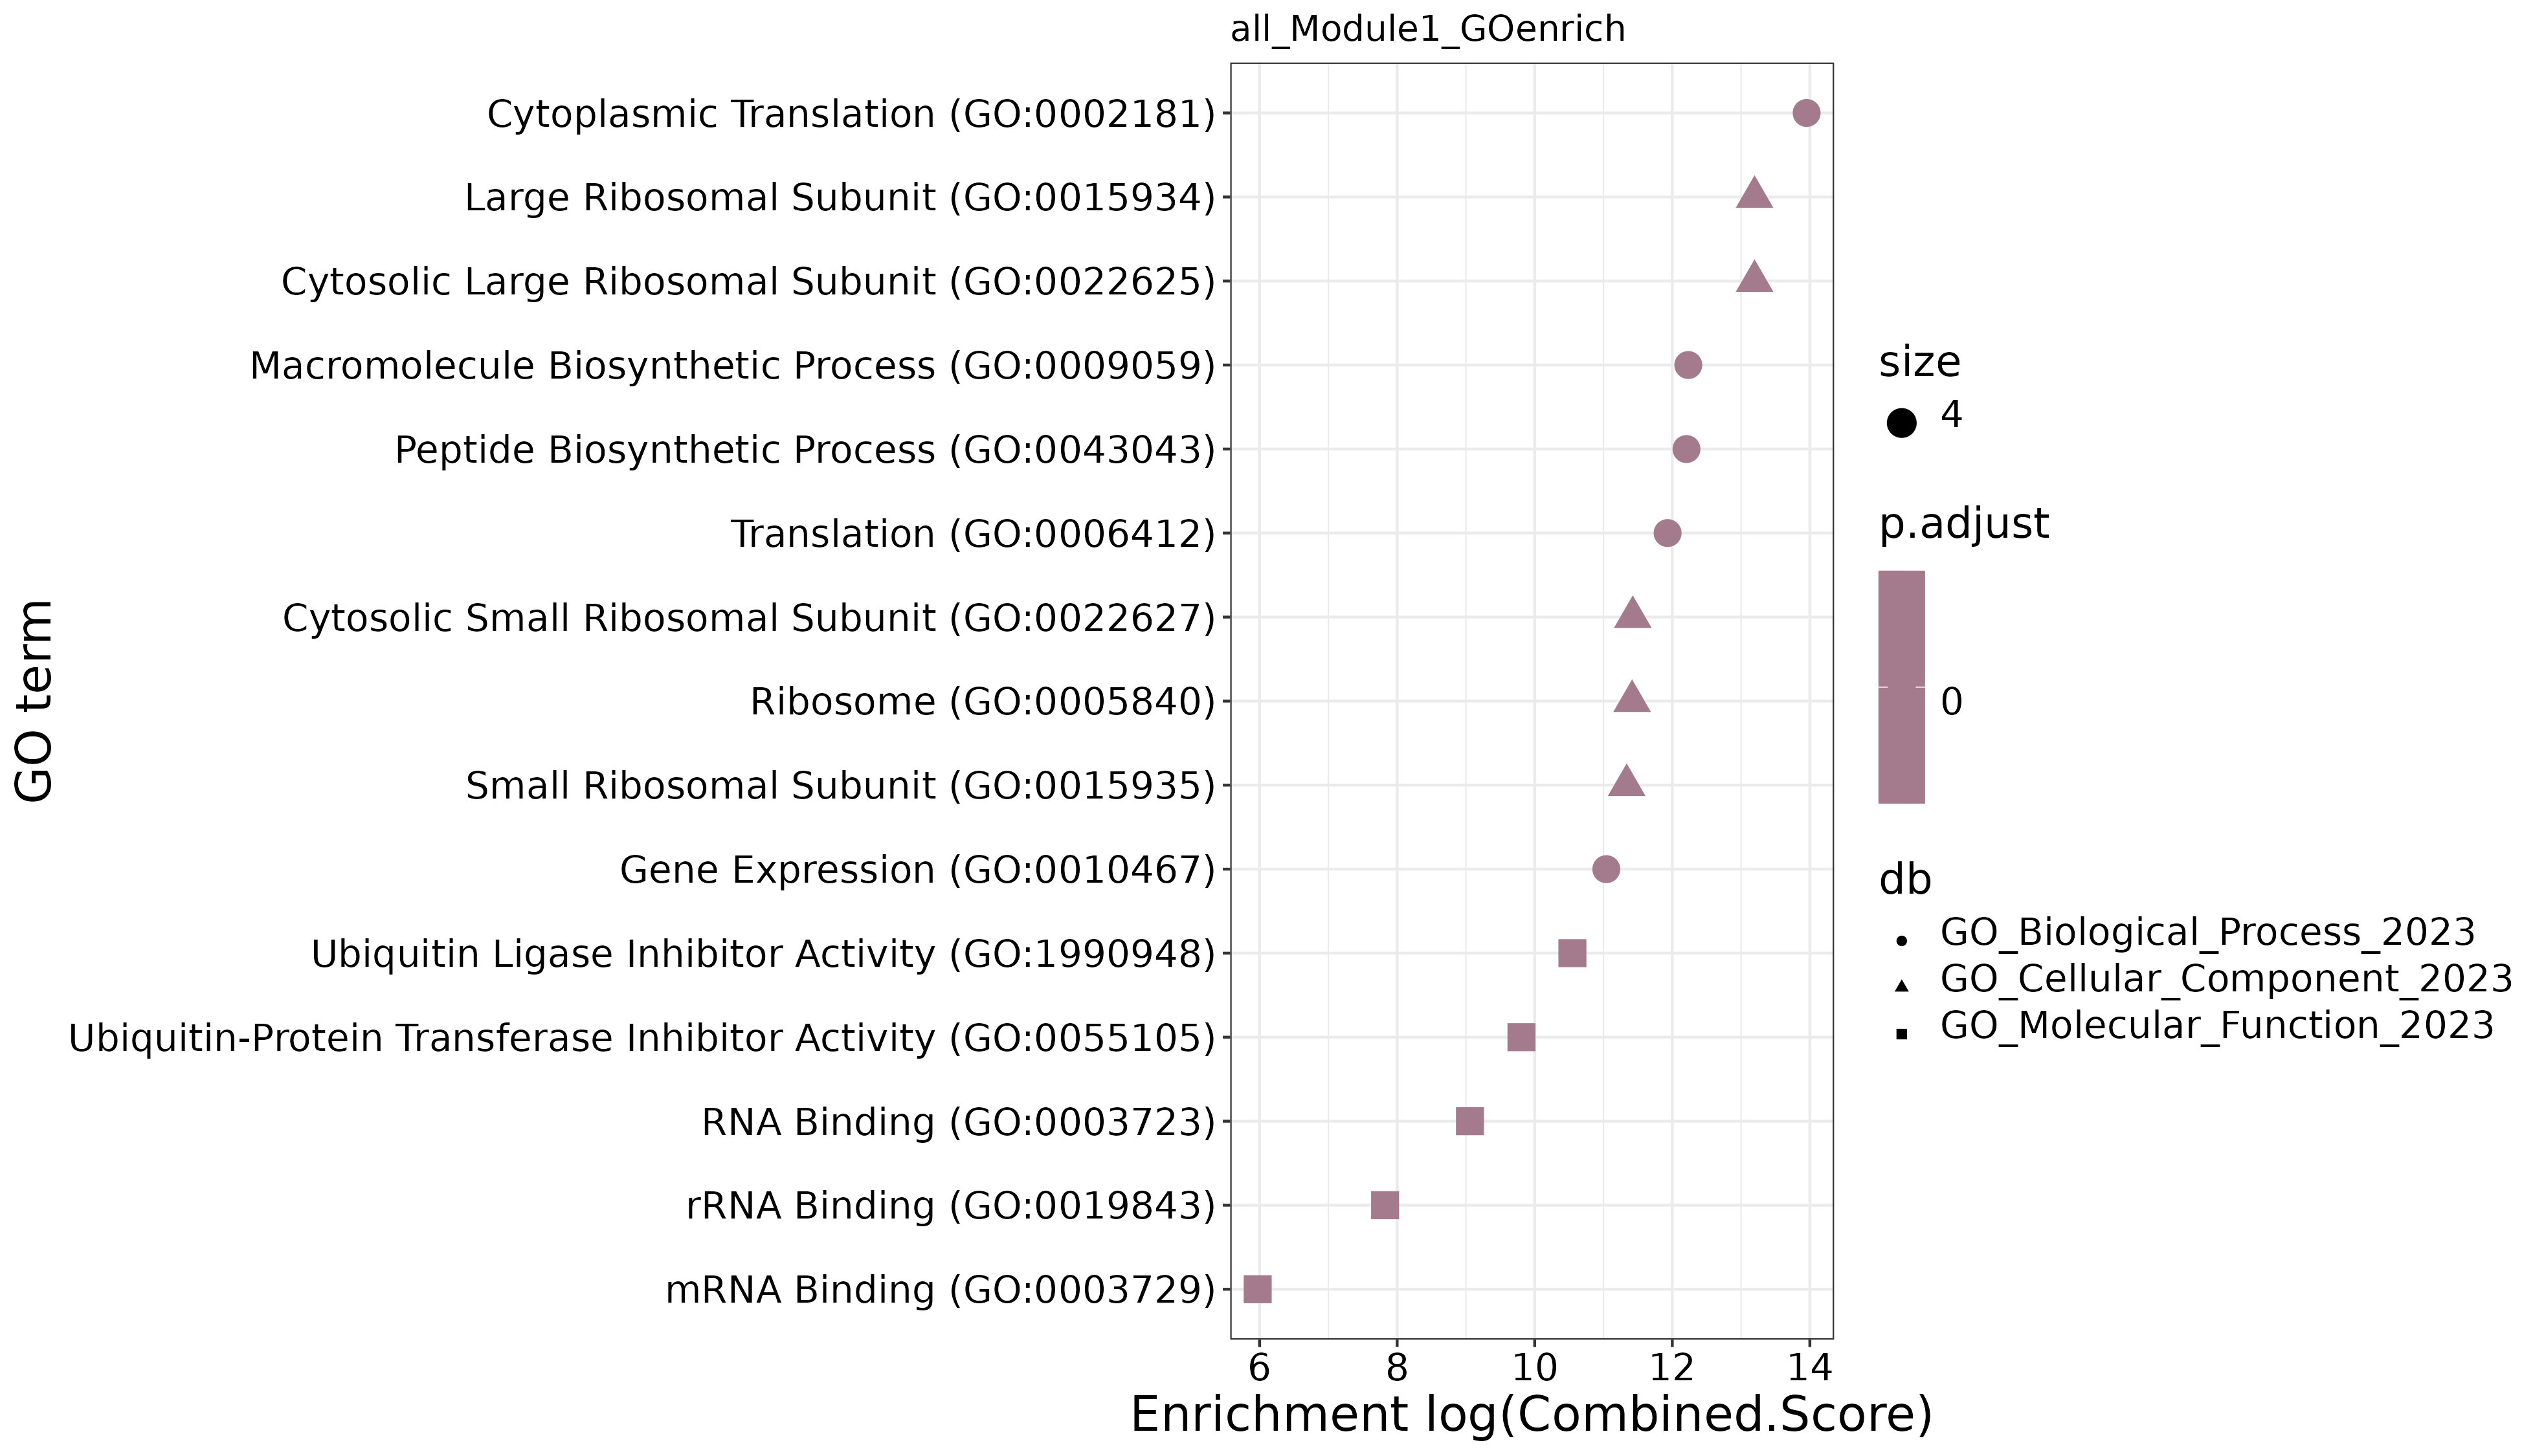
- Chart Interpretation: Shows the GO functional enrichment results of module genes.
- X-axis: Enrichment score
- Y-axis: GO terms
- Color: Indicates enrichment significance
- Dot Size: Represents the number of genes enriched in the GO term
Application Cases
Case 1: Identifying Immune-Related Functional Modules in the Tumor Microenvironment
- Literature: Morabito S, Miyamoto A, Pochareddy S, et al. bioRxiv. 2022.
- Background: Researchers wanted to identify gene modules related to immune escape and suppression in tumor tissues, focusing on tumor-infiltrating T cells and macrophage subsets.
- Analysis Strategy: Run hdWGCNA separately on annotated T cell subsets and macrophage subsets, select the
variablegene set and use UCell for module activity scoring; then perform KME screening on modules and conduct GO/KEGG enrichment analysis, and finally perform differential analysis of module activity between tumor and control samples. - Key Findings:
- Identified an "immune suppression module" specifically upregulated in tumor-infiltrating macrophages, which contains PD-L1(CD274), IDO1, and several metabolism-related genes.
- This module was significantly upregulated in advanced samples (differential analysis FDR < 0.05) and highly overlapped with tumor-associated macrophage marker genes (KME>0.7).
- GO/KEGG results suggested that this module is enriched in pathways such as "immune suppression" and "tryptophan metabolism", suggesting potential immune regulatory mechanisms that can be used as therapeutic targets.
Case 2: Identification of Specific Functional Modules During Development
- Literature: Langfelder P, Horvath S. BMC Bioinformatics. 2008.
- Background: Study functional reprogramming of cell types between different time points during embryonic development, hoping to identify early development-specific modules.
- Analysis Strategy: Group cells by time point, use the
fractionmethod to select genes expressed in at least 20% of cells, construct a weighted co-expression network and use dynamic tree cutting to identify modules; perform time-series Module Eigengene analysis and enrichment analysis on the modules. - Key Findings:
- Found a module highly expressed in early development, containing various stemness maintenance-related genes (such as SOX2, NANOG-related pathway genes), whose Module Eigengene decreased over time.
- GO enrichment of this module showed entries related to "stem cell maintenance" and "cell cycle regulation", supporting its functional role in early development.
- By overlapping with single-cell annotation results, it was proven that this module is enriched in progenitor/stem cell subsets.
Case 3: Identification and Verification of Drug Treatment Response-Related Modules
- Literature: Ricchiuti V, Li J, Shi J, et al. J Transl Med. 2021.
- Background: Compare treated and control cells to find drug response-related gene modules, and verify key genes through in vitro experiments.
- Analysis Strategy: Merge Seurat objects of the treated and control groups, run hdWGCNA and calculate Module Score for each cell; perform differential analysis of module activity between the treated and control groups, and select genes with high KME values for subsequent experimental verification.
- Key Findings and Verification:
- Identified a significantly upregulated "stress response module" containing several drug-metabolizing enzymes and stress-related transcription factors.
- The top 3 genes with the highest KME values in the module were selected for qPCR and Western blot verification, and the experimental results were consistent with the changes in module activity, confirming the biological reliability of the hdWGCNA results.
Notes and Best Practices
TIP
Avoid overinterpretation: hdWGCNA results are computational inferences based on transcriptomic data and do not equal real regulatory relationships. Any key findings need to be confirmed by subsequent biological experiments.
Frequently Asked Questions (FAQ)
Q1: How long does hdWGCNA analysis take?
A: The analysis time depends on the data scale and computing resource configuration. Generally speaking:
- Small datasets (1,000-5,000 cells): 1-2 hours
- Medium datasets (5,000-20,000 cells): 2-6 hours
- Large datasets (>20,000 cells): 6-24 hours or longer It is recommended to enable Downsample to speed up the analysis.
Q2: What is the significance of KME values and Module Scores?
A:
- KME (Module Membership): Module membership, representing the correlation between a gene and the module's characteristic gene. A higher KME value indicates a gene belongs more to the module.
- Module Scores: Module scores, representing the activity level of a module in a single cell. Calculated using UCell or Seurat methods.
Q3: How to determine the biological significance of a module?
A: The biological significance of a module can be determined through the following methods:
- Functional enrichment analysis: Understand the potential functions of the module through GO/KEGG and other enrichment analyses
- Marker gene overlap: Overlap analysis with known cell type marker genes
- Differential analysis: Analyze the activity differences of the module between different cell types
Q4: How to verify the reliability of hdWGCNA analysis results?
A: The reliability of results can be verified through the following ways:
- Biological verification: Verify key module functions by combining known literature and databases
- Experimental verification: Verify key module genes through reporter gene experiments and other methods
- Cross-validation: Verify result consistency using different datasets or analysis methods
References
Langfelder P, Horvath S. WGCNA: an R package for weighted correlation network analysis. BMC Bioinformatics. 2008 Dec 29;9:559. doi: 10.1186/1471-2105-9-559. PMID: 19116021; PMCID: PMC2631488.
Zhang B, Horvath S. A general framework for weighted gene co-expression network analysis. Stat Appl Genet Mol Biol. 2005 Aug 12;4:Article17. doi: 10.2202/1544-6115.1128. Epub 2005 Aug 12. PMID: 16646834.
Morabito S, Miyamoto A, Pochareddy S, et al. Single-cell co-expression analysis identifies distinct regulatory programs in the developing human cortex. bioRxiv. 2022 Jan 1;2022.01.01.474662. doi: 10.1101/2022.01.01.474662.
Miller JA, Cai C, Langfelder P, et al. Strategies for aggregating gene expression data: the collapseRows R function. BMC Bioinformatics. 2011 Jul 13;12:302. doi: 10.1186/1471-2105-12-302. PMID: 21752256; PMCID: PMC3152543.
Ricchiuti V, Li J, Shi J, et al. A practical guide to single-cell RNA sequencing for biomedical research and clinical applications. J Transl Med. 2021 Sep 14;19(1):394. doi: 10.1186/s12967-021-02974-0. PMID: 34521462; PMCID: PMC8438992.